
Last month, a competitor told our joint client: “We are the fastest-growing website in this segment.” That sounded appealing and was certainly worth investigating. Twenty minutes later, I discovered that their actual visitor numbers were only about 40% of what they claimed. The client didn’t ask how I knew that, but if they had, they would have been shocked by my answer. All the data I used was free, legal, and publicly available.
Analytics agencies always try to make you believe that website traffic data is only available for a fee. That is not true. This data is spread across many sources, each providing different information. Tools don’t make talent; talent makes tools. True expertise lies in knowing which free sources to integrate and how to interpret the meaning behind the data.
In this article, we explore five methods, from the most obvious to the more specialized. Each part is a piece of the puzzle. By combining the two methods above, you get a sufficiently accurate estimate of visitor numbers for competitive analysis, collaboration decisions, or simply to satisfy your curiosity.
Method 1: SimilarWeb — Overview
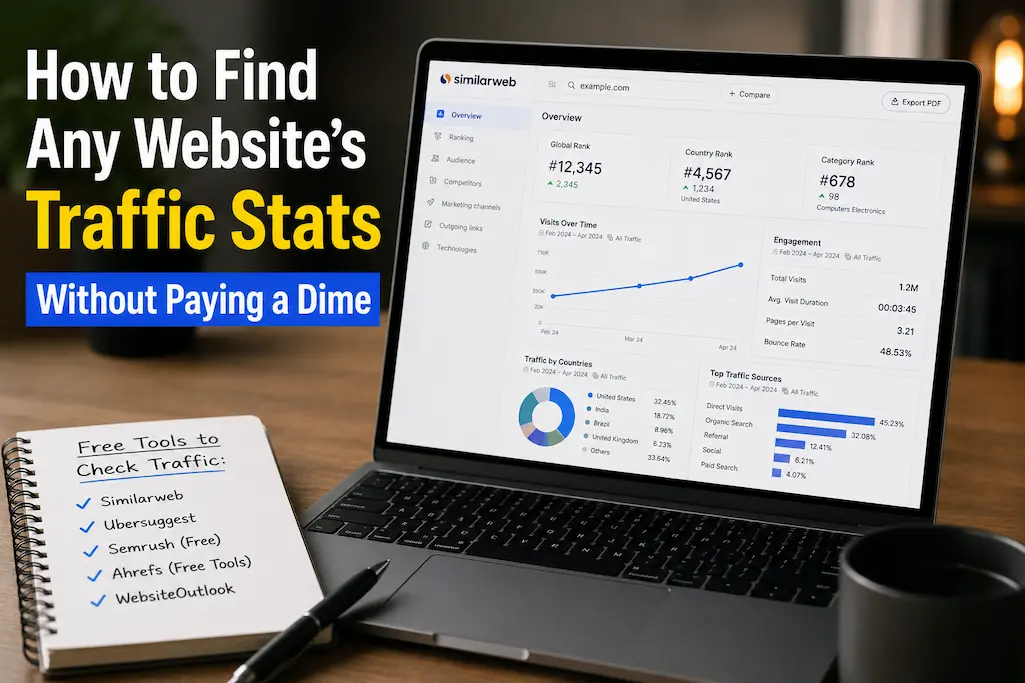
SimilarWeb is the tool that comes closest to the free industry standard. Enter a domain name to get an estimate of the number of monthly visits, traffic sources, audience geographic distribution, and competitor information. The free version has limited functionality: only five results per month, and the data is displayed with a delay of 30-90 days. However, for most quick estimates, this is sufficient.
Viewing data: Total number of monthly visits, average visit duration, pages per visit, bounce rate, traffic source segmentation (direct visits, search engines, social media, referrals, display ads), major referring websites, major target websites, audience interests.
Accuracy: SimilarWeb’s estimates for websites with more than 100,000 monthly visits typically fall within 30-50% of the actual traffic. For smaller websites, the margin of error can rise to 100% or even higher. It is recommended to use the estimates as a reference rather than as absolute statistics.
Tip for professionals: Compare SimilarWeb’s estimates with the actual data. The difference between the two indicates how much SimilarWeb’s data should be adjusted for websites of similar size.
Method 2: Semrush Free Tier — The Search Lens
Semrush is primarily an SEO tool, but the free version also offers a traffic estimate. After entering the domain name, Semrush displays the expected organic search traffic, popular keywords, and paid search campaigns.
It is important to note here: search traffic, not total traffic. For websites with a lot of content, search traffic typically accounts for 60-80% of the total number of visits. For e-commerce or direct-to-consumer websites, this percentage can range between 20-30%. It is therefore crucial to understand which type of website you are analyzing.
Displayed content: Organic traffic estimate, top 10 keywords, keyword ranking breakdown, paid keywords and estimated spending, backlink overview
Limitations: The free version only shows the top 10 keywords and a subset of data points. An in-depth analysis requires a paid subscription. However, the free data is sufficient for benchmarking competitors.
Key Insight: If Semrush shows 50K monthly organic visits and you know search drives 70% of traffic in this niche, you can estimate total traffic around 70K. The math isn’t perfect, but it’s better than guessing.
Method 3: The Social Media Reverse Lookup
Traffic tools miss social-driven visits. But you can estimate them manually with surprising accuracy.
Find the website’s social accounts. Check their posting frequency and average engagement per post (likes + comments + shares). Apply these rough multipliers based on 2026 platform data:
| Platform | Avg. Click-Through Rate | Calculation Example |
|---|---|---|
| 1.5-3% | 10K followers × 3% engagement × 2% CTR = 6 clicks/post | |
| Twitter/X | 1-2% | 5K followers × 2% engagement × 1.5% CTR = 1.5 clicks/post |
| 2-4% | 2K followers × 4% engagement × 3% CTR = 2.4 clicks/post | |
| 3-5% | 8K followers × 5% engagement × 4% CTR = 16 clicks/pin |
Multiply clicks per post by posting frequency. A site posting twice daily to Instagram with 6 clicks per post gets roughly 360 social visits monthly. Again, directional — but it fills a gap that SimilarWeb and Semrush miss.
Method 4: The Backlink Math
Backlinks correlate strongly with traffic. More links from reputable sites mean more referral visits and better search rankings. Use free tools to count and assess links:
Moz Link Explorer (free tier): Shows domain authority, linking domains, and top pages. Limited to 10 queries per month.
Ahrefs Backlink Checker (free): Shows top 100 backlinks and referring domains. No registration required.
Ubersuggest (free tier): Shows backlink count, domain score, and top linked pages.
The specific trick: compare the target site’s backlink profile to a site whose traffic you know. If Site A has 500 referring domains and gets 100K monthly visits, and Site B has 250 referring domains in the same niche, Site B likely gets roughly 40-60K visits. The correlation isn’t linear, but it’s consistent enough for estimation.
Method 5: The Archive and Trend Hack
This is the most obscure method — and sometimes the most revealing.
Wayback Machine (archive.org): Check how frequently a site has been archived. High-frequency archiving usually correlates with high traffic or high update frequency. A site archived 50 times in the past year is likely more active than one archived twice.
Google Trends: Search the brand name or domain. A flat line suggests stagnant traffic. A rising line suggests growth. Compare multiple competitors on the same graph to see relative momentum.
Google Search “site:domain.com”: The number of indexed pages gives a rough sense of content volume. More content doesn’t always mean more traffic, but it’s a variable in the equation. A site with 10 indexed pages and high traffic is doing something exceptional. A site with 10,000 indexed pages and low traffic is doing something wrong.
Pro Tip: Combine all five methods for a single site, then compare your estimate to any public statements the site makes. If they claim “millions of monthly visitors” but SimilarWeb shows 200K, Semrush shows 50K organic, and their social accounts are tiny, you have a story. Not necessarily that they’re lying — but that their “visitors” metric includes bots, repeat counts, or other inflation.
Putting It Together: The Estimation Worksheet
Here’s how I synthesize the data for a final estimate:
- Base from SimilarWeb: 150K estimated monthly visits
- Adjust for known accuracy: My comparable site runs 20% higher than SimilarWeb, so real traffic ≈ 180K
- Cross-check with Semrush: 80K organic monthly visits. If search is 60% of traffic in this niche, total ≈ 133K. Discrepancy suggests either SimilarWeb is high or search share is different than assumed.
- Add social estimate: Instagram + Twitter + LinkedIn ≈ 15K monthly visits
- Consider backlink strength: 400 referring domains, slightly below my 180K benchmark site. Suggests the lower estimate (133-150K) is more accurate.
- Final estimate: 140-160K monthly visits. Wide enough to account for error. Narrow enough to be useful.
The process takes 25-30 minutes for a thorough analysis. Five minutes if you just need a rough order of magnitude. Either way, it’s free and more accurate than most paid tools’ marketing claims.
What These Methods Can’t Tell You
Honest limitations matter:
Real-time data: Everything here is delayed by weeks or months. You can’t see yesterday’s traffic spike.
Subdomain precision: Tools often aggregate subdomains (blog.example.com with example.com). You can’t easily separate them without paid tools.
Mobile app traffic: If a site has a popular app, web traffic tools miss that entirely. A “low traffic” site might have a million app users.
Dark social: Traffic from messaging apps (WhatsApp, Slack, Discord) is nearly invisible to all tracking. Some niches get 30%+ of visits from these sources.
Paid traffic masking: Sites buying heavy display ads can inflate “direct” traffic numbers. SimilarWeb shows the volume but not always the source.
Warning: Never make partnership or investment decisions based solely on free traffic estimates. Use them for directional insight, competitive positioning, and negotiation leverage. For decisions involving real money, pay for verified data or ask the site directly for analytics access.
The Ethics of Traffic Investigation
Everything described here uses publicly available data. You’re not hacking, scraping private information, or violating terms of service. But ethics still apply:
- Don’t publicly shame competitors based on estimates — the error margin makes you look foolish if wrong
- Don’t use traffic data to poach advertisers with misleading comparisons
- Do use it to verify claims, benchmark your own growth, and make informed partnership decisions
Transparency about your methods builds more trust than secretive data gathering ever will.
Related Articles
- How to Check If a Website Is Safe Before You Click
- Browser Features Hidden in Plain Sight (You’ve Never Clicked These)
- Small Teams, Big Collaboration: Free Web Tools That Actually Work
- Expensive Software Replaced: 15 Free Online Tools You Never Knew Existed
- Geo-Blocked Content? Access It Legally and Safely With These Tools
Sources and References
- SimilarWeb. (2026). Methodology: How We Estimate Website Traffic and Engagement. SimilarWeb Knowledge Base. https://www.similarweb.com/corp/en/about/methodology/
- Semrush. (2026). Traffic Analytics: Data Sources and Accuracy. Semrush Blog. https://www.semrush.com/blog/
- Moz. (2026). Domain Authority and Link Explorer Methodology. Moz Learning Center. https://moz.com/learn/seo/domain-authority
- Internet Archive. (2026). Wayback Machine: Archiving Frequency and Web Crawl Data. Archive.org. https://archive.org
- Google Trends. (2026). Search Interest Data: Interpretation and Limitations. Google Trends Help. https://trends.google.com
About the Author: The InsightTrail team believes competitive intelligence should be accessible, not expensive. We dig through public data so you can make decisions based on facts rather than marketing claims.

Sunita Voss wanders through software like a city flâneur—observing, testing, occasionally getting lost, always finding shortcuts. She writes about digital minimalism, hidden web tools, and tech hacks with the patience of someone who enjoys the journey and the urgency of someone who values her time. No gurus. No gatekeeping. Just discovered paths.